Financial Statements and Information
Save the Children has a proven track record of using donations efficiently and effectively. From school children who send their allowance for relief efforts to the largest philanthropic donors, we cherish all of our supporters. You can be assured that Save the Children uses the valuable resources donors have provided in the most cost-effective ways possible.
Our independently audited financial statements consistently show that out of every dollar spent, 86 cents goes directly toward helping children. We keep administrative costs low so that more funding goes to children’s programs.
Save the Children Program Funding
In fiscal year 2022, 86% of all expenditures went to program services.

Give with confidence, and learn more about where your donation goes.
Learn More About How Save the Children Is Funded
Save the Children relies on a combination of funding sources to uphold our mission of providing children in the U.S. and around the world with a healthy start to life, the opportunity to learn and protection from harm.
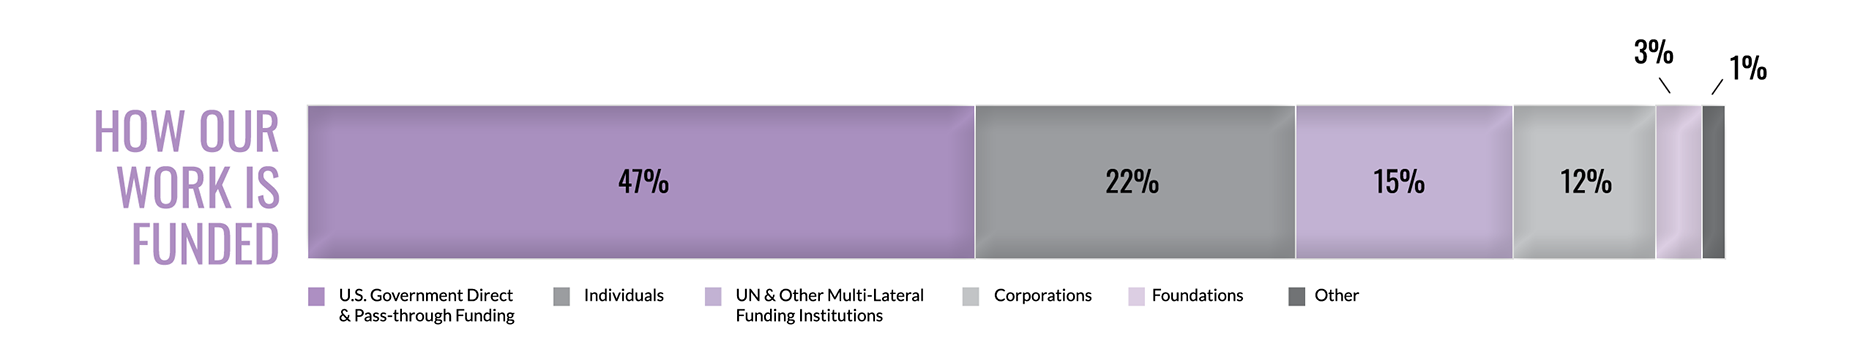
In fiscal year 2022, 47% of our work was funded by U.S. Government Direct & Pass-through Funding
22% of our work was funded by Individuals
15% of our work was funded by UN & Other Multi-lateral Funding Institutions
12% of our work was funded by Corporations
3% of our work was funded by Foundations
1% of our work was funded by other sources
Financial Statements and Additional Information
Save the Children is committed to donors’ rights and transparency. That’s why we make our financial statements, administrative costs and funding available for your review online.
Looking for your donor financial information? Sign-in to your account to find your annual summary of giving under the Manage My Giving section. Your summary of giving for the previous year will become available in January of the next year.
Additional Information and 990s
Information concerning Save the Children Federation, Inc., including copies of its IRS Forms 990 and 990-T, may be obtained without cost by calling 1.800.728.3843, writing to Save the Children Federation, Inc. at 501 Kings Highway East, Fairfield, CT 06825 or send an email to [email protected]
Thank you for signing up! Now, you’ll be among the first to know how Save the Children is responding to the most urgent needs of children, every day and in times of crisis—and how your support can make a difference. You may opt-out at any time by clicking "unsubscribe" at the bottom of any email.
By providing my mobile phone number, I agree to receive recurring text messages from Save the Children (48188) and phone calls with opportunities to donate and ways to engage in our mission to support children around the world. Text STOP to opt-out, HELP for info. Message & data rates may apply. View our Privacy Policy at savethechildren.org/privacy.